


Employee surveys are a crucial tool for businesses looking to understand how their employees feel about their work, their colleagues, and their organization as a whole. These surveys can provide valuable insights into areas that need improvement and help to identify potential problems before they become organizational issues.
But simply collecting survey data is not enough. To truly understand the meaning behind your results, you need to analyze the data in a thoughtful and systematic way.
In this article, we’ll discuss the steps you can take to uncover the meaning in your employee survey analytics.
Evaluating Your Survey Response Rate
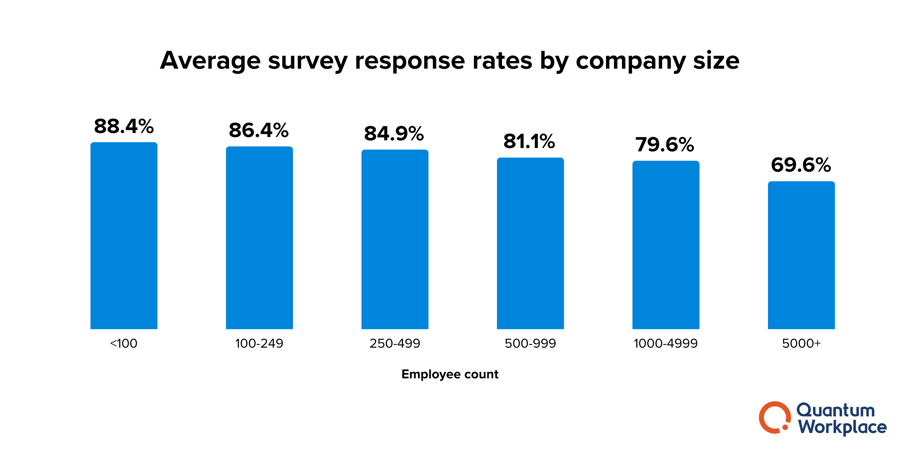
Before your survey even closes, it's important to analyze your survey response rate. Your survey analytics are only as good as the data that goes into it. If your survey response rate is too low, you may want to address why that is before using that data to drive change.

What is a good survey response rate?
A good response rate for an employee survey should be 70% or higher.
As a benchmark, we like to suggest between 70-80% for larger organizations (500+ employees) and between 80-90% for smaller organizations (<500 employees).
What if my response rate is lower than it should be?
Analyzing your response rate is a critical first step to uncovering meaning in your data. A low response rate can skew your results and make it difficult to draw meaningful conclusions.
But that’s not all. A low response rate may indicate that employees do not feel comfortable sharing their opinions, which could be a sign of larger problems within the organization.
If your survey response rate is lower than you expect it to be, the first step is not to panic. Remember that employee listening is a continuous process and it may take time for your flywheel to start turning out great data.
The good news is, there are some strategies you can adopt to improve your survey response rate!
Tips on improving your survey response rate over time:
Try sending reminder emails: If your initial response rate is quite low, try sending a reminder email. Reminder emails can have a huge impact on results. In general, response rates tend to hover around 60% before the first reminder and can reach 70% with the second reminder. You may want to keep nudging until your response rates are as high as 90%!Communicate value: Don’t just ask folks to fill out the survey. This is a great opportunity for you to educate your employees on how you plan to use their responses to make change within the organization. When applicable, remind them that their responses are anonymous. Engagement surveys, in particular, offer the unique opportunity for every single employee voice to be heard! Make sure your employees know this is their shot to make the company a better place. This may help to address employees who feel survey fatigue.
Head on over to our guide if you want to learn more actionable tips on how to improve your survey response rate.
How to Uncover Meaning in Your Employee Survey Results
Once you have a good response rate, you can begin to uncover meaning within your survey results. There are a few ways you can start to slice and dice your survey data to uncover meaning. We’ll cover each of these methods in a bit more detail.
1. Evaluate and Prioritize by Favorability
One common metric used to measure employee engagement is favorability. Favorability is a measure of how positively or negatively employees feel about a particular aspect of their work, such as their relationship with their manager or their overall job satisfaction.
|
A savvy employee survey tool will easily evaluate and prioritize favorability in your analytics. Quantum Workplace’s report looks like this:

How to use favorability scores to prioritize action items
Once you have calculated favorability scores for each aspect of your survey, you can use this information to prioritize action items.
Areas with low favorability scores indicate that employees are not satisfied with this aspect of their work and may need additional attention.
You can use these low scores to create a list of priorities for improvement and develop an action plan to address these issues.
But that’s not all. Favorability at an organizational-level may not be giving you all the data you need to make business decisions. If you’re able, spend time slicing your data by key business demographics like department, job level, age, gender, and more.
Slicing and comparing your favorability data by demographic may help you identify hidden pain points within your survey data. And that’s where heat mapping becomes a powerful tool.
2. Use Heat Mapping to Compare Favorability by Demographic
Heat mapping takes your favorability analysis to the next level. Heat mapping is a valuable tool because it can help HR leaders understand concentrations of employee perceptions throughout different organizational demographics.
An intuitive heat map report makes it easy for you to visualize different groups and compare them to a benchmark - either internally or externally.

For example, you may find through your heat mapping that employees aged 26-35 show low favorability scores on workplace flexibility questions. This is a great opportunity for you to flag that data for a follow up pulse survey where you can ask that specific demographic what ‘workplace flexibility’ means to them.
Not only do heat map reports make it easy for you to interpret your data, but it makes it easy to share that data as well. With easy year-over-year comparisons, you can track how your investments in specific demographics lead to improved results over time.
3. Identify and Evaluate Keywords and Narratives Within Your Survey Comments
Of course, most surveys will be made up of easily-measurable questions, like Likert scales, multiple choice, and yes/no questions.
But in addition to numerical data, many survey tools provide text-based open responses from employees.
But reading every single open response item is tedious and unhelpful. That’s why you need a tool that can help you summarize employee comments, identify keywords, and surface narrative insights within your data.
With a Comments Report, you can start to identify the theme, sentiment, and subtext within your written analytics.
- Comment summarization: Reviewing every comment can be time-consuming. AI comment summarization tools can quickly create easy-to-read summaries of your survey comments, helping you understand and respond to feedback faster.
- Theme analysis: Your survey tool may be able to crawl your comments and align them with common workplace themes like excellence, team dynamics, and more.
- Sentiment analysis: You can use the language within your comments to determine the sentiment behind responses. Sentiment can be negative, positive, mixed, or unclear. By evaluating sentiment, you can get a broader view of how employees feel about certain prompts.
- Text analytics: Stories can be hidden in your survey data. And text analytics can help you tell it. Text analytics not only helps you identify trending keywords, but buckets those keywords by sentiment - so you can begin to prioritize by theme.

Narrative analysis can help you gain a deeper understanding of employee concerns and identify specific areas that may require additional attention.
4. Use industry survey benchmarks
Industry survey benchmarks can be a useful tool for understanding how your organization compares to others in your industry.

Many survey tools provide benchmark data that you can use to compare your results to industry averages. This data can help you identify areas where you are performing well or where you may need to improve.
For example, if your favorability scores for employee satisfaction are below industry averages - even if it seems good enough to you - you may want to look at how other organizations are addressing this issue and utilize their strategies as a starting point for your own action plan.
5. Empower your managers to analyze their team results
Uncovering meaning should not be isolated to the organizational level. Segmenting your survey data by team—and sharing it with your people leaders—can enable your managers quickly and easily prioritize engagement at the ground level.

A Team Report can provide analytics and insights that are most relevant to the team. These data points might include:
- Team response rate
- Overall team favorability
- The ability to compare team results to previous surveys
- Lowest favorable high-impact items
The Team Report also provides smart insights which highlight the highest favorability, lowest favorability, and the strongest survey item compared to the overall company. These insights can be taken into action planning from the team report for quick action on the manager's behalf.
There is a lot that can be learned from teams that have high favorability scores. What are they doing well? What makes that team unique? You may be able to uncover easy action items simply by studying what your organization is already doing well at the team-level.
6. Help your employees understand their role in engagement
One of the best ways to uncover meaning in your survey data is to open that data up to the entire organization. With tools like Quantum Workplace’s My Engagement Report (ME Report) your employees can see how they stack up against the rest of the organization’s survey results.
The best part is? The ME Report is completely confidential to the individual employee. Meaning they can feel safe to explore their responses and the organization's responses without fear of retribution or discovery.
Confidential self-reporting doesn’t just tie your data back to the individual. But ME Reporting can help to share the responsibility of improving engagement directly with the employee. The ME Report can highlight recommendations for the individual to improve their own experience.
How to use results to develop an organization-wide action plan
To develop an organization-wide action plan, it's important to involve key stakeholders, including HR leaders, department heads, and senior management.
You should start by sharing the survey results with these stakeholders and discussing the areas of the survey that need improvement. Communicating survey results to the management team is an important step in driving meaningful action across the organization.
When presenting the results, it's important to focus on key takeaways and actionable insights. Avoid overwhelming the team with too much data and instead provide clear recommendations for next steps.
From your analysis above, it may be prudent to point out:
- What areas of the business have very high favorability?
- What areas of the business have the lowest favorability?
- How is favorability varied by demographic?
- What stories have been found in open comments using text analytics?
- Which results could we improve with simple changes?
- Which survey questions have the greatest impact on engagement?
- Can any items be grouped under one theme?
- What were our lowest scoring areas?
From there, you can work together to develop a plan that addresses these issues and sets measurable goals for improvement.
How to prioritize your action items
If you’re struggling to prioritize action items, you’re not alone. Prioritization can be challenging. Especially if you’re surprised to find that favorability is lower in multiple areas than you expected.
- Align your priorities with business goals: If you’re struggling to retain employees, it’s a good time to run an analysis on your exit survey data. If you’re struggling to attract the right talent, perhaps you should analyze your recruitment survey data. Your employees are using surveys to try and help you improve. Use your data to determine how to solve those organizational pain points.
- Involve your employees in the solution: There are a few ways you can get your employees more involved in developing an action plan. You can send pulse surveys to low-favorability groups and ask them what is most important to them. You can create employee advocacy groups whose role is to represent the employee voice within the larger organization. And you can use focus groups so that different voices have a chance to provide more meaningful feedback directly to your leadership team.
- Continuously survey & communicate: Prioritization is only as good as your action items. To create a flywheel of continuous employee listening, you should be regularly surveying your employees and communicating your action steps at every step of the process.
To have the most impact, starting with two or three focus areas is a great place to move the needle.
What should my survey action plan look like?
Once you’ve determined your focus areas and communicated those with management and the larger organization, it’s time for your action plan to start.
95% of employees who say their leaders and managers are exceptional at communicating and taking effective action on survey results are highly engaged.
Your action plan should include specific goals, timelines, and action steps for addressing the areas of the survey that need improvement. This may include changes to company policies, additional training or support for employees, or changes to the physical work environment.
It's important to make sure that your action plan is achievable and measurable, so that you can track progress and make adjustments as needed.
Your survey tool may provide you with the tools you need to design and manage your action plan. Quantum Workplace not only allows you to seamlessly connect your survey data with your focus areas—you can assign and track specific action items over time across the organization.
![]()
You can also:
- Assign action plan owners, viewers and contributors
- Enable notifications and comment threads
- Dive deeper into focus areas with AI-powered team discussion starters
- Generate AI-driven action ideas personalized to team context
- Maintain regular communication and updates on plans to track progress

Best of all, when all your action plans are in one place, you can measure the effectiveness of your surveys and action plans over time—and adjust your plans as needed.
Analyzing employee survey data is a critical step in understanding employee engagement and identifying areas for improvement within your organization.
By uncovering meaning in your data, prioritizing action items, and developing an actionable plan for improvement, you can drive change and create a more engaged and productive workforce.
With the right tools and resources, you can use your survey data to build a culture of continuous listening and collaboration that empowers employees and drives success for your organization.
Start uncovering meaning in your survey data
Are you ready to turn your data into action? Quantum Workplace’s employee engagement software has helped thousands of organizations uncover meaning in their survey data with powerful employee engagement survey tools and analytics.

.png?width=520&height=294&name=Employee%20Engagement%20Trends%202026%20(4).png)
![What is a Performance Review [Definition]: Types of Performance Reviews](https://www.quantumworkplace.com/hs-fs/hubfs/Marketing/Website/Blog/Blog%20Images/what%20is%20a%20performance%20review.png?width=520&height=294&name=what%20is%20a%20performance%20review.png)